

The Agency for Statistics under the President of Tajikistan has released a new report on household budgets with data for 2024, published in 2025. The report provides an in-depth look at how families in Tajikistan live, how much they earn, and where they spend their money—both in urban and rural areas.
The main takeaway from the report is clear: expenses continue to rise, and the bulk of household budgets are still spent on food.
Income increases, but so do expenses
Over the past few years, household incomes have risen significantly. In 2017, the average income per family member was 329.68 somoni per month, whereas in 2024, this figure had increased to 1,110.42 somoni—more than three times higher.
However, almost all of this income is spent on current expenses. In 2024, families spent an average of 1,108.16 somoni per month per person, leaving no room for savings.
Food: the largest expense
In 2024, food accounted for 570 somoni per month per person—more than half of all household expenses (51.3%). To put this into perspective, in 2017, food expenses were just 162 somoni, meaning they have more than tripled over the past seven years. This increase is not only due to higher incomes but also the rising cost of food.
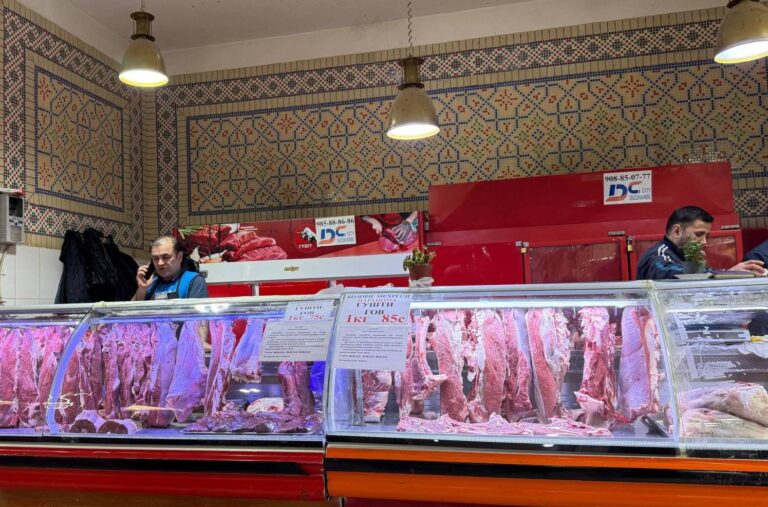
In 2024, the breakdown of food expenses showed that the largest share went to bread and bakery products—30.9%—followed by meat and meat products at 24%. A significant portion of the budget was spent on vegetable oil (8.2%) and vegetables (7.8%). Meanwhile, fish and dining out accounted for the smallest portion of household spending.
Structure of food expenditure in 2024
1. Bread and Bakery Products: 30.90%
o Primary food product, staple of the diet.
2. Meat and Meat Products: 24%
o Important source of protein and nutrients.
3. Vegetable Oil: 8.20%
o Used for cooking and in salads.
4. Vegetables and Greens: 7.80%
o Source of vitamins, minerals, and fiber.
5. Fruits and Berries: 5.40%
o Source of vitamins, antioxidants, and fiber.
6. Milk and Dairy Products: 17.20%
o Source of calcium and protein.
7. Others: 6.50%
Non-food goods and services
The second-largest share of the household budget went to non-food goods—clothing, footwear, household appliances, and other purchases. In 2024, families spent 35.6% of their total budget on these items, which equates to a little over 395 somoni per person per month.
Services accounted for 12.2% of household spending, or 135.6 somoni per month. The largest portion of this category went to housing and utilities—28.6% of all expenses—followed by transportation (15.3%), communications (15%), and medical services (6%).
Structure of service expenditure in 2024
1. Housing and utility services: 28.60%
o Expenses for communal services.
2. Other personal services: 22.30%
o Various personal services, not categorized separately.
3. Passenger transport: 15.30%
o Expenses related to transportation services.
4. Communications services: 15%
o Expenses for communications services.
5. Household Services: 6.30%
o Expenses related to domestic services.
6. Medical treatment: 6%
o Expenses for healthcare services.
7. Education: 6.50%
o Expenses for education services.
Urban vs. rural: a noticeable difference
The report highlights significant differences between urban and rural households. In 2024, the average income per person in urban areas was 1,401 somoni per month, compared to 934 somoni in rural areas. As a result, spending was also higher in cities—an average of 1,374 somoni per person compared to 937 somoni in rural areas.
Additionally, the structure of expenses differs between urban and rural households. In cities, food accounts for a higher share of spending—54%, compared to 47% in rural areas. Conversely, rural households spend a larger proportion on non-food goods—39% compared to 32% in cities.
Changes in spending over the years
Compared to 2023, the overall volume of household expenses remained almost the same in 2024. However, families increased their spending on food, while expenses on non-food goods and services slightly decreased. This may indicate that rising food prices are prompting families to adjust their budgets to prioritize basic needs.
What do people in Tajikistan eat?
On average, in 2024, each person annually consumed:
· 170 kg of bread
· 129.5 kg of vegetables
· 43.8 kg of potatoes
· 36.9 kg of fruits
· 24.8 kg of meat
· 176 eggs
Urban residents ate more meat, bread, and vegetables, while rural residents consumed slightly more milk.
This pattern reflects the ongoing shifts in consumption habits, driven by income, food prices, and regional differences in food availability.