

Over the first three months of this year, Tajikistan’s foreign trade turnover valued at $2.69 billion, 21-percent increase compared to the same period last year, according to the Customs Service under the Government of Tajikistan.
Over the reporting period, exports reportedly grew at a higher rate — by 32.1%, reaching $538.9 million. Imports over the same three-month period increased by 18.4% and amounted to $2.15 billion.
The share of exports in the overall structure of the country’s foreign trade turnover increased from 18.3% to 20%, while imports still account for the predominant part — about 80% of the total volume.
We examined the key positions of foreign trade turnover: which goods entered the top 10 in exports and imports.
Top 10 export products:
TOP 10 EXPORTS
No. Commodity group Exports Volume
1 Ore and slag $222.2 mln 80,600 tons
2 Non-precious metals $81.9 mln about 4,000 tons
3 Aluminum and products $63.3 mln 19,900 tons
4 Cotton $41.7 mln 25,500 tons
5 Fuel and petroleum products $34.8 mln about 127,000 tons
6 Copper and products $20.8 mln 2,000 tons
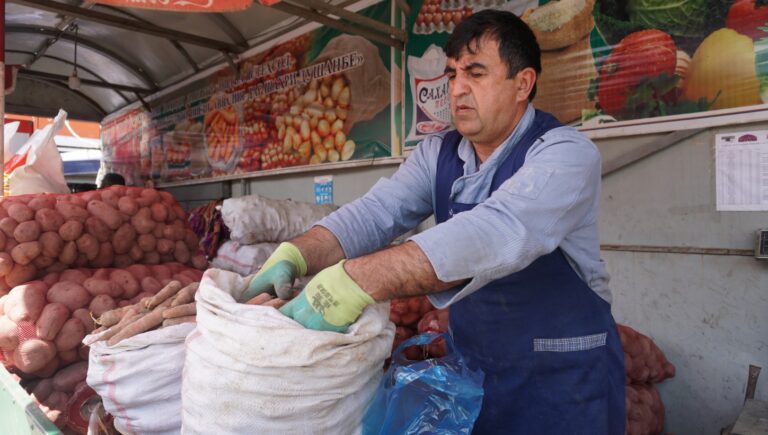
7 Fruits and nuts $18.5 mln 31,000 tons
8 Equipment and mechanical
devices $11.6 mln —
9 Clothing $7.96 mln —
10 Salt, sulfur, lime, and cement $4 mln 52,600 tons
Main positions in the import of non-food goods:
TOP 10 IMPORTS: NON-FOOD GOODS
| No. | Commodity group | Imports | Volume (if available) |
| 1 | Transport vehicles | $253.8 mln | — |
| 2 | Ferrous metals | $209.3 mln | 370,400 tons) |
| 3 | Equipment and mechanical devices | $182.9 mln | — |
| 4 | Electrical equipment | $138 mln | — |
| 5 | Wood and wood products | $77.3 mln | — |
| 6 | Plastics and products | $65 mln | — |
| 7 | Products made of ferrous metals | $57.8 mln | — |
| 8 | Fertilizers | $15.2 mln | 41,800 tons |
| 9 | Cleaning products (detergents) | $14.9 | — |
| 10 | Perfumery and cosmetics | $14.4 mln | — |
Main positions in the import of food products:
TOP 10 FOOD IMPORTS
| № | Product category | Imports | Volume (if available) |
| 1 | Grains | $93.5 mln | 373,800 tons |
| 2 | Fats and oils | $53.5 mln | 45,000 tons |
| 3 | Prepared cereal products | $41.1 mln | 13,000 tons |
| 4 | Fruits and nuts | $30.6 mln | 45,000 tons |
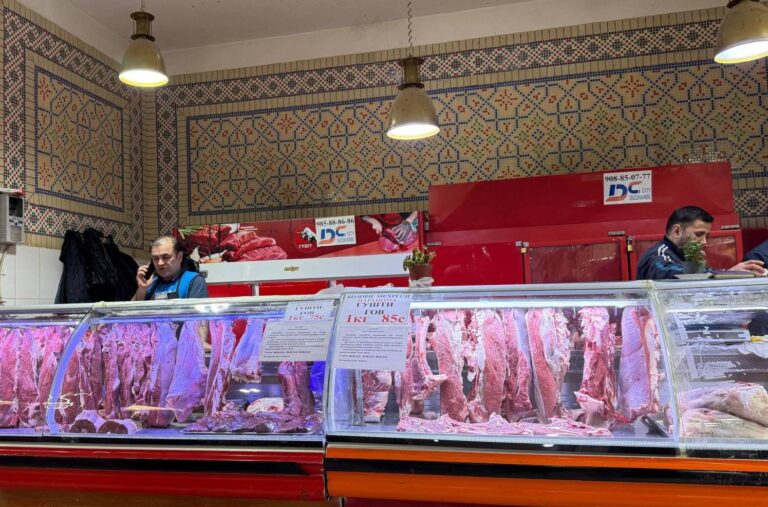
| 5 | Meat and meat products | $29.3 mln | 7,500 tons |
| 6 | Sugar and confectionery products | $22.2 mln | 24,400 tons |
| 7 | Animal feed | $20.6 mln | 52,700 tons |
| 8 | Cocoa and products | $18.5 mln | 3,800 tons |
| 9 | Vegetables | $17.9 mln | 74,100 tons |
| 10 | Other food products | $16.9 mln | 6,200 tons |